Answer two questions only
1. (a)
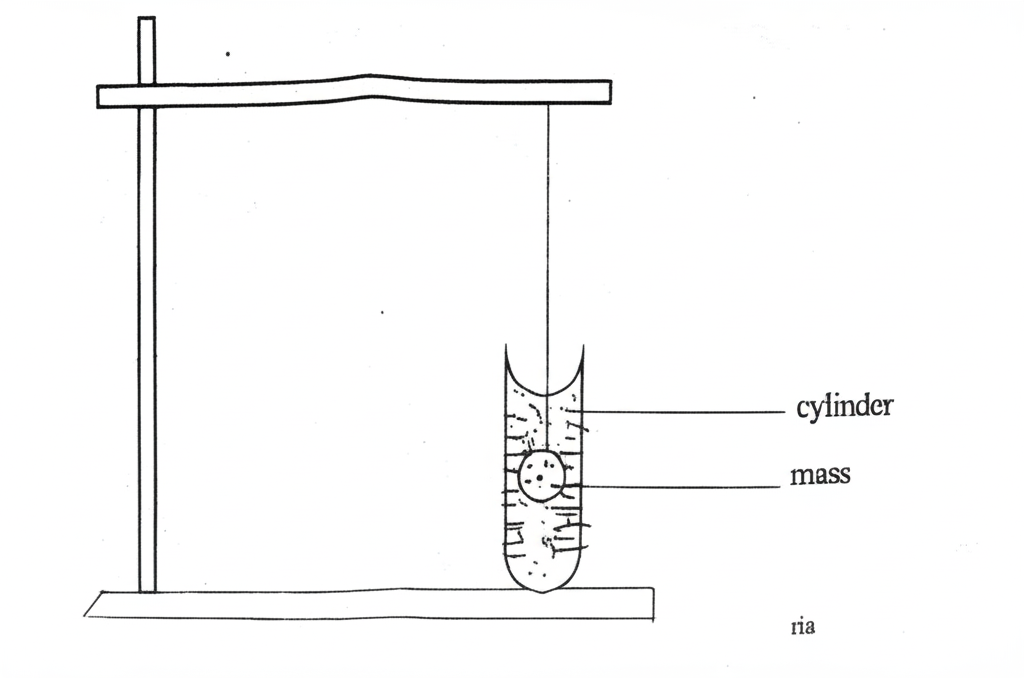
The diagram above illustrates a cylinder of inner diameter, \( D = 7.0 \text{ cm} \), containing kerosene at a depth, \( L = 8 \text{ cm} \). A mass, \( m \), is immersed in the kerosene and the new depth, \( h \), is read and recorded. The procedure is repeated for four other values of \( m \), and the corresponding values of \( h \) are read and recorded.
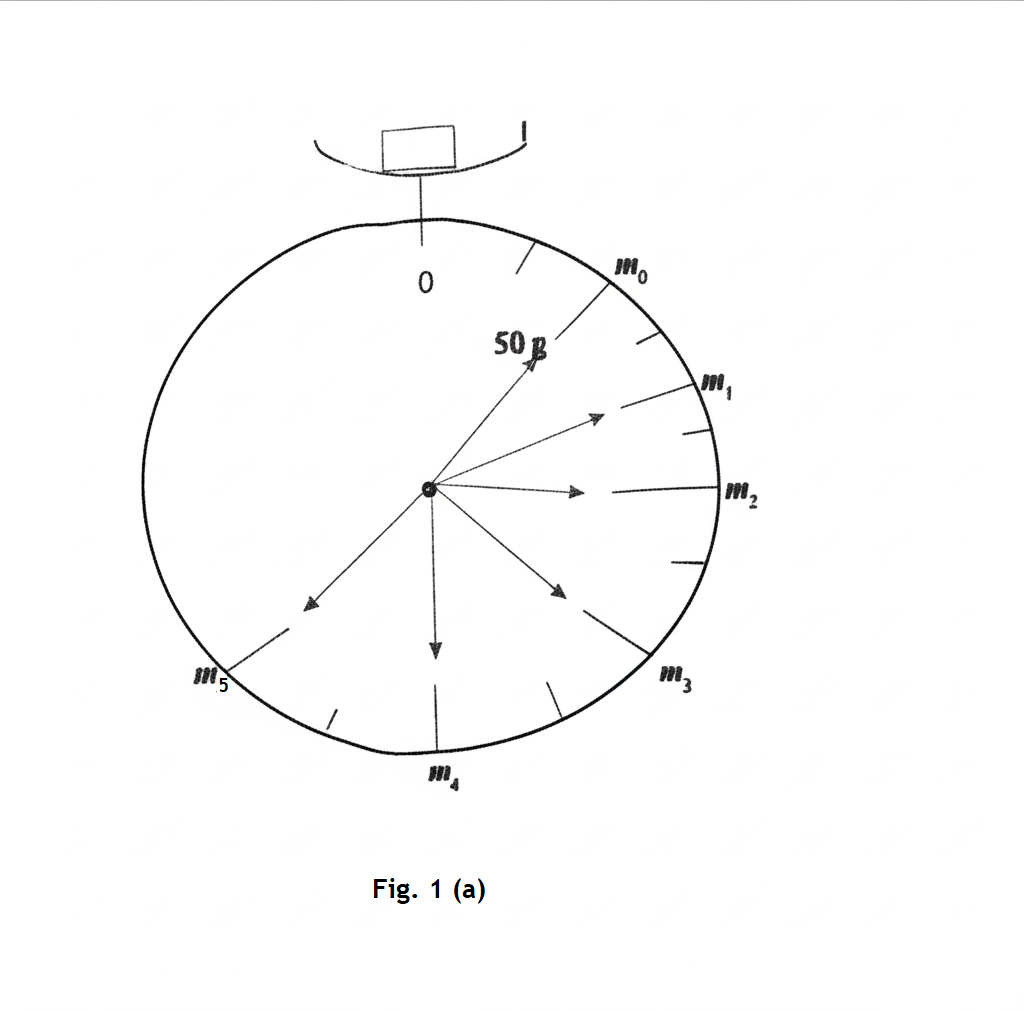
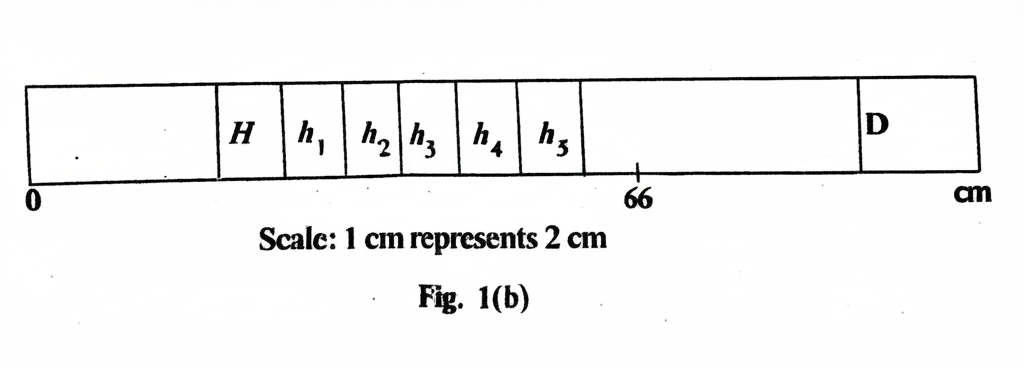
Fig. 1(a) shows \( m_i \) and Fig. 1(b) shows the corresponding \( h_i \) where \( i = 1, 2, 3, 4 \text{ and } 5 \).
(i) Read and record \( m_i \).
(ii) Measure and record \( h_i \).
(iii) Use the given scale to convert \( h_i \) to real value \( H \).
(iv) Evaluate \( X = H - L \) and \( Y = D^2X \) in each case.
(v) Tabulate the result.
(vi) Plot a graph of \( m \) on the vertical axis and \( Y \) on the horizontal axis.
(vii) Determine the slope, \( s \), of the graph.
(viii) Evaluate \( k = \frac{4s}{\pi} \) [\( \pi = 3.14 \)].
(ix) State two precautions necessary to ensure accurate results when performing this experiment.
[21 marks]
(b) (i) State Archimedes' Principle.
[2 marks]
(\( \alpha \)) sink;
(\( \beta \)) float.
[2 marks]
Answers to Question 1a - b
(i) Read and record \( m_i \):
From Fig. 1(a):
\( m_0 = 50 \) g
\( m_1 = 100 \) g
\( m_2 = 150 \) g
\( m_3 = 200 \) g
\( m_4 = 250 \) g
\( m_5 = 300 \) g
(ii) Measure and record \( h_i \):
From the bar diagram in Fig. 1(b)
Here are the measured values for \( h_i \):
\( h_0 = 17.0 \) cm
\( h_1 = 18.5 \) cm
\( h_2 = 20.0 \) cm
\( h_3 = 21.5 \) cm
\( h_4 = 23.0 \) cm
\( h_5 = 24.5 \) cm
(iii) Convert \( h_i \) to real height \( H \) using the scale:
1 cm on the diagram = 2 cm in real life
\( H_0 = 2 \times 17.0 = 34.0 \) cm
\( H_1 = 2 \times 18.5 = 37.0 \) cm
\( H_2 = 2 \times 20.0 = 40.0 \) cm
\( H_3 = 2 \times 21.5 = 43.0 \) cm
\( H_4 = 2 \times 23.0 = 46.0 \) cm
\( H_5 = 2 \times 24.5 = 49.0 \) cm
(iv) Evaluate \( X = H - L \):
Given:
\( L = 8.0 \) cm
Previously computed \( H \) values:
\[ H = 34.0, \; 37.0, \; 40.0, \] \[\; 43.0, \; 46.0, \; 49.0, cm \]
\( X_0 = 34.0 - 8.0 = 26.0 \) cm
\( X_1 = 37.0 - 8.0 = 29.0 \) cm
\( X_2 = 40.0 - 8.0 = 32.0 \) cm
\( X_3 = 43.0 - 8.0 = 35.0 \) cm
\( X_4 = 46.0 - 8.0 = 38.0 \) cm
\( X_5 = 49.0 - 8.0 = 41.0 \) cm
Evaluate \( Y = D^2 \times X \):
We’re given:
\( D = 7.0 \) cm
So, \( D^2 = 49.0 \) cm²
Previously calculated \( X \) values:
\[ X = 26.0, \; 29.0, \; 32.0, \] \[\; 35.0, \; 38.0, \; 41.0, cm\]
\( Y_0 = 49 \times 26.0 = 1274.0 \) cm³
\( Y_1 = 49 \times 29.0 = 1421.0 \) cm³
\( Y_2 = 49 \times 32.0 = 1568.0 \) cm³
\( Y_3 = 49 \times 35.0 = 1715.0 \) cm³
\( Y_4 = 49 \times 38.0 = 1862.0 \) cm³
\( Y_5 = 49 \times 41.0 = 2009.0 \) cm³
(v) Tabulated Results
| Mass \( m \) (g) | \( h \) (cm) | \( H \) (cm) | \( X = H - L \) (cm) | \( Y = D^2 \times X \) (cm³) |
|---|---|---|---|---|
| \( 50 \) | \( 17.0 \) | \( 34.0 \) | \( 26.0 \) | \( 1274.0 \) |
| \( 100 \) | \( 18.5 \) | \( 37.0 \) | \( 29.0 \) | \( 1421.0 \) |
| \( 150 \) | \( 20.0 \) | \( 40.0 \) | \( 32.0 \) | \( 1568.0 \) |
| \( 200 \) | \( 21.5 \) | \( 43.0 \) | \( 35.0 \) | \( 1715.0 \) |
| \( 250 \) | \( 23.0 \) | \( 46.0 \) | \( 38.0 \) | \( 1862.0 \) |
| \( 300 \) | \( 24.5 \) | \( 49.0 \) | \( 41.0 \) | \( 2009.0 \) |
(vi) Plotted Graph
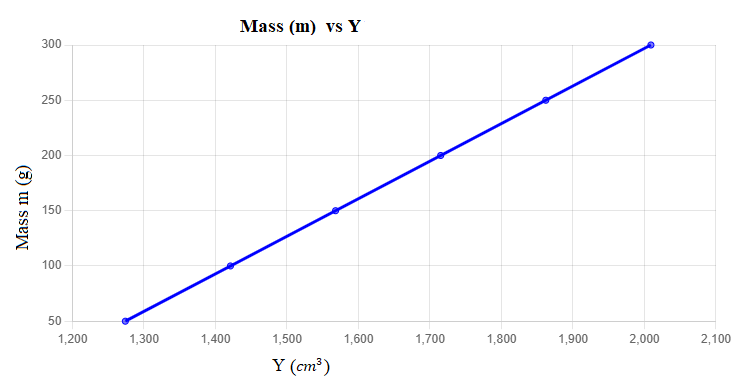
(vii) Slope (s):
\[ \text{slope} = \frac{m_2 - m_1}{Y_2 - Y_1} \]
Using the points \( (1274.0, 50) \) and \( (2009.0, 300) \):
\[ \text{slope} = \frac{300 - 50}{2009.0 - 1274.0}\] \[= \frac{250}{735} \approx 0.34 \]
Slope (s) is: 0.34 g/cm³
(viii) Evaluate \( k \):
\[ k = \frac{4s}{\pi} \]
Substituting \( s = 0.34 \) and \( \pi = 3.14 \):
\[ k = \frac{4 \times 0.34}{3.14}\] \[= \frac{1.36}{3.14} \approx 0.4331 \]
Final Result:
\[ k \approx 0.433 \]
(ix) Two Precautions:
Take readings at eye level to avoid parallax error.
Make sure the mass is fully submerged and still before measuring the liquid level.
(b) (i) Archimedes' Principle:
When an object is fully or partially immersed in a fluid, it experiences an upward force (called upthrust) equal to the weight of the fluid displaced by the object.
(ii) Conditions for Floating and Sinking:
(α) Sink:
An object sinks if its weight is greater than the upthrust, i.e., it is denser than the fluid.
(β) Float:
An object floats if its weight is equal to or less than the upthrust, i.e., it is less dense than the fluid.
2. (a)
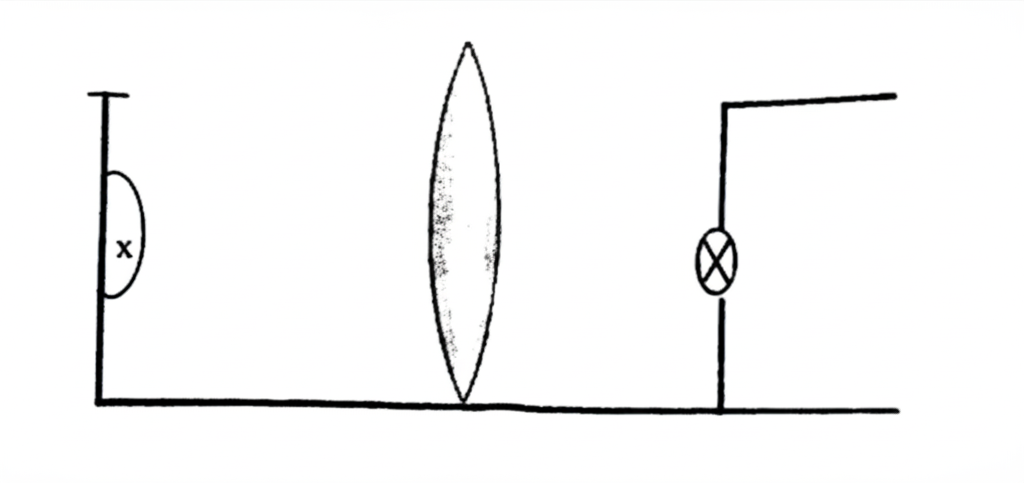
The diagram above illustrates a ray box placed at a distance \( x_i \) from a convex lens of focal length \( f \). The screen was adjusted until a sharp image of the cross wire of the ray box is formed at a distance \( y_i \) from the lens. The procedure is repeated for various values of \( x_i \), and the corresponding values of \( y_i \) were obtained for \( i = 1, 2, 3, 4 \text{ and } 5 \).
Fig. 2(a) and Fig. 2(b) illustrate the various values of \( x_i \) and the corresponding values of \( y_i \) respectively for \( i = 1, 2, 3, 4 \text{ and } 5 \).
Using the figures illustrated above, carry out the following instructions:
(i) Measure and record the raw values of \( x_i \) for \( i = 1, 2, 3, 4 \text{ and } 5 \).
(ii) Evaluate the converted values \( X \) of \( x_i \).
(iii) Measure and record the raw values of \( y_i \).
(iv) Evaluate the converted values \( Y \) of \( y_i \).
(v) Evaluate \( P = \frac{Y}{X} \) in each case.
(vi) Plot a graph of \( P \) on the vertical axis and \( Y \) on the horizontal axis, starting both axes from the origin.
(vii) Determine the slope, \( s \), of the graph.
(viii) Evaluate \( K = \frac{1}{s} \).
(ix) Determine the value of the focal length, \( f \), of the convex lens.
(x) State two precautions necessary to ensure accurate results when performing this experiment.
[21 marks]
(b) (i) State two characteristics of images formed by a convex lens.
[2 marks]
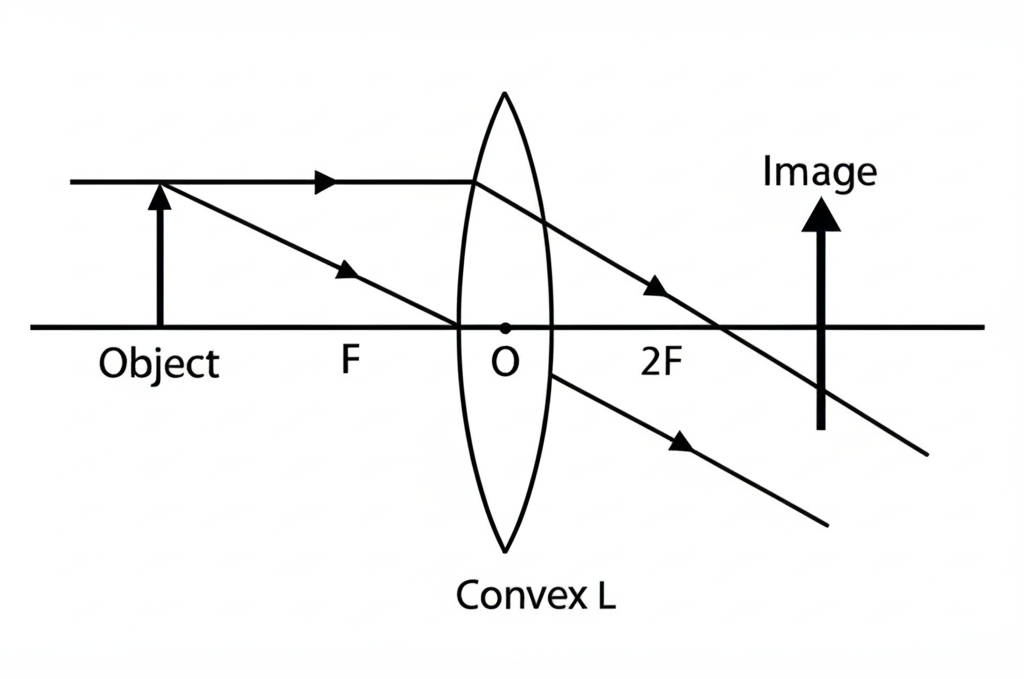
(ii) Draw a ray diagram showing the image of an object formed when the object is placed between the optical center and the principal focus of a convex lens.
[2 marks]

Answers to Question 2a - b
(i) Recorded raw values of \( x_i \):
From measurements:
\( x_1 = 1 \) cm
\( x_2 = 2 \) cm
\( x_3 = 3 \) cm
\( x_4 = 4 \) cm
\( x_5 = 5 \) cm
(ii) Converted values \( X \) of \( x_i \):
(Since 1 cm on paper represents 5 cm in actual distance)
\( X_1 = 1 \times 5 = 5 \) cm
\( X_2 = 2 \times 5 = 10 \) cm
\( X_3 = 3 \times 5 = 15 \) cm
\( X_4 = 4 \times 5 = 20 \) cm
\( X_5 = 5 \times 5 = 25 \) cm
(iii) Recorded raw values of \( y_i \) for \( i = 1,2,3,4,5 \):
From measurements:
\( y_1 = 5 \) cm
\( y_2 = 4 \) cm
\( y_3 = 3 \) cm
\( y_4 = 2 \) cm
\( y_5 = 1 \) cm
(iv) Converted values \( Y \) of \( y_i \) for \( i = 1,2,3,4,5 \):
(Since 1 cm on paper represents 5 cm in actual distance)
\( Y_1 = 5 \times 5 = 25 \) cm
\( Y_2 = 4 \times 5 = 20 \) cm
\( Y_3 = 3 \times 5 = 15 \) cm
\( Y_4 = 2 \times 5 = 10 \) cm
\( Y_5 = 1 \times 5 = 5 \) cm
(v) Evaluated values of \( P = \frac{Y}{X} \) for \( i = 1,2,3,4,5 \):
\( P_1 = \frac{25}{5} = 5.00 \)
\( P_2 = \frac{20}{10} = 2.00 \)
\( P_3 = \frac{15}{15} = 1.00 \)
\( P_4 = \frac{10}{20} = 0.50 \)
\( P_5 = \frac{5}{25} = 0.20 \)
(vi) Plotted Graph
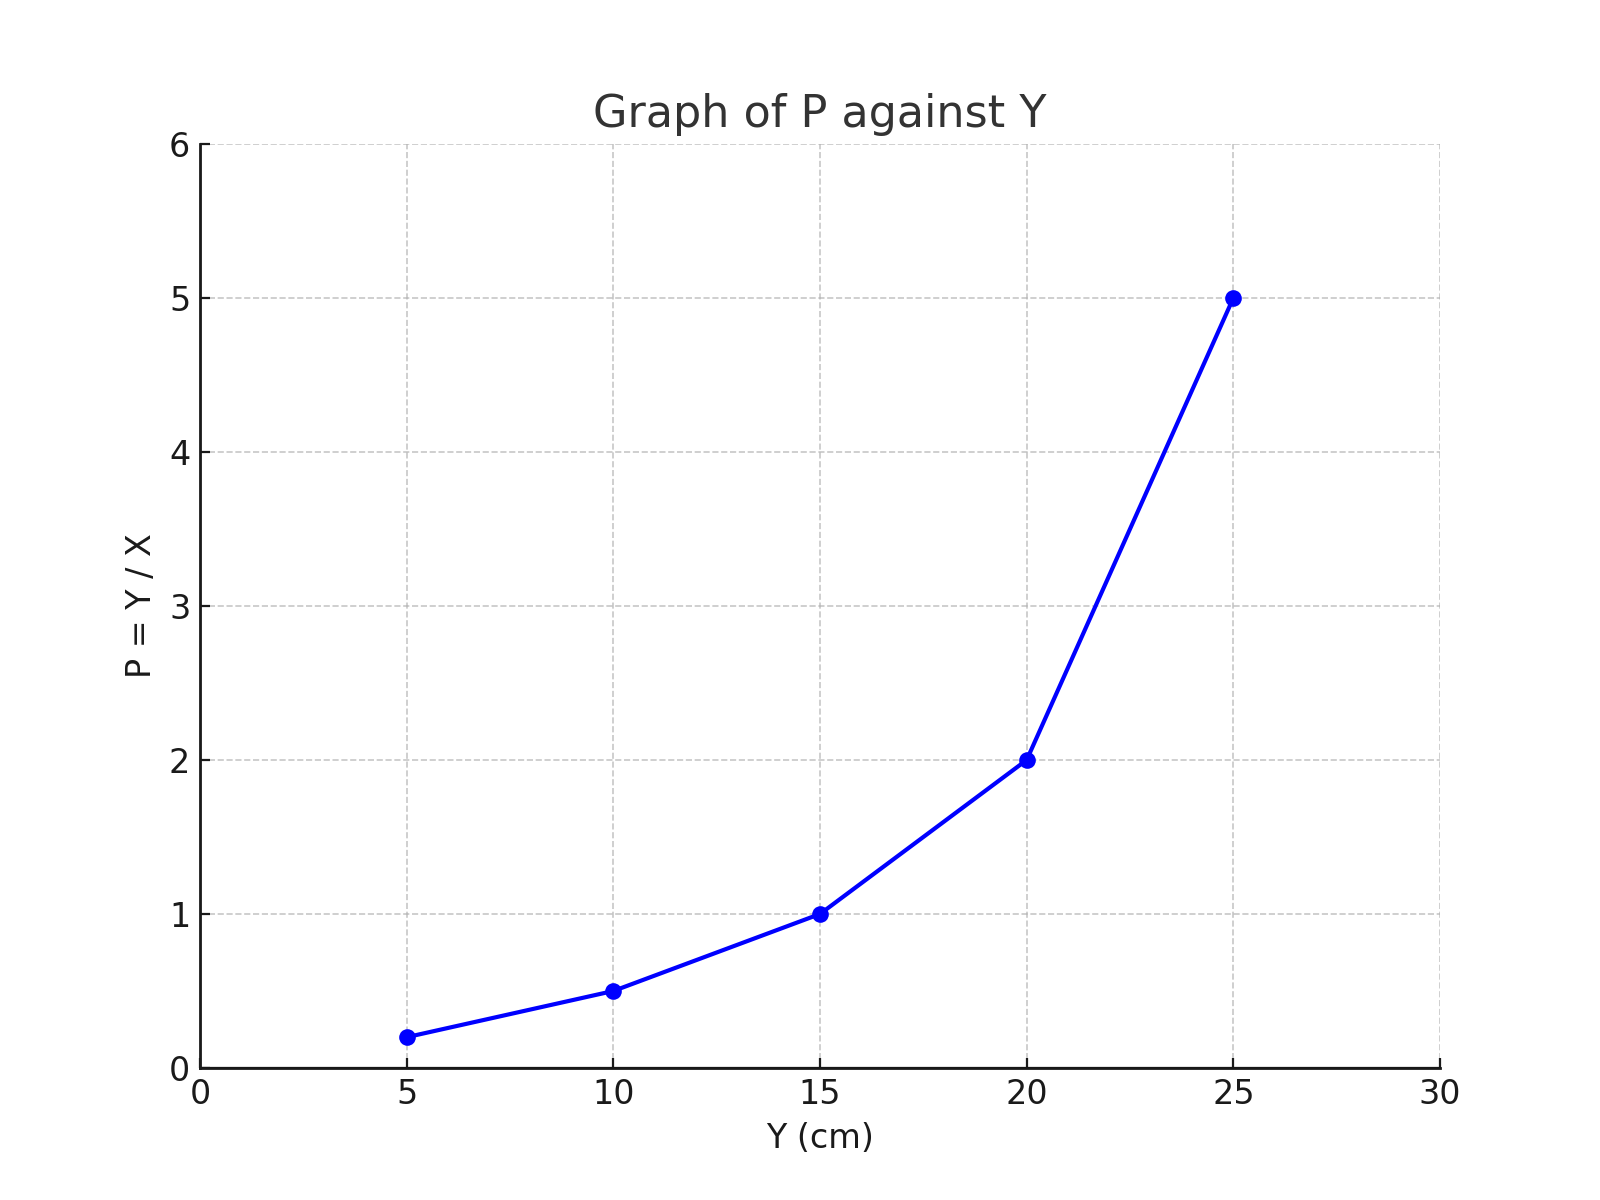
(vii) Determine the slope \( s \) of the graph:
We will estimate the slope \( s \) of the graph using two points from the straight-line portion of the curve. The line appears roughly linear between:
Point A: \( (Y_2 = 20, P_2 = 2.00) \)
Point B: \( (Y_4 = 10, P_4 = 0.50) \)
Using the slope formula:
\[ s = \frac{P_2 - P_4}{Y_2 - Y_4}\] \[= \frac{2.00 - 0.50}{20 - 10}\] \[= \frac{1.50}{10} = 0.15 \]
Slope \( s = 0.15 \)
(viii) Evaluate \( K = \frac{1}{s} \):
\[ K = \frac{1}{0.15} = 6.67 \]
\( K = 6.67 \)
(ix) The value of the focal length \( f \) of the convex lens is:
From lens formula relationships used in this experiment, the focal length \( f \) is given by:
\[ f = K = 6.67 \text{ cm} \]
Focal length \( f = 6.67 \text{ cm} \)
(x) Two precautions necessary to ensure accurate results:
Ensure the lens and screen are placed perpendicular to the optical bench to avoid parallax errors in measurement.
Avoid parallax error when reading the positions of the object and image by ensuring your eye is level with the scale.
(b) (i) Two characteristics of the image formed by a convex lens:
The image can be real and inverted when the object is placed beyond the focal point.
The image can be virtual, upright, and magnified when the object is placed between the optical center and the focal point.
(vi) Ray Diagram
3. (a)

The circuit above is used to determine the electric power of a device. The circuit is closed and the rheostat is adjusted. The current, \( I \), registered on the ammeter is recorded. The corresponding voltage registered on the voltmeter is recorded.
Fig. 3(a) shows the values of the current, \( I_i \),
Fig. 3(b) shows the corresponding values of voltage, \( V_i \),
where \( i = 1, 2, 3, 4 \text{ and } 5 \).
(i) Record the values, \( I_i \).
(ii) Evaluate \( \log I_i \).
(iii) Record the values, \( V_i \).
(iv) Evaluate \( \log V_i \).
(v) Tabulate the results.
(vi) Plot a graph with \( \log V \) as ordinate and \( \log I \) as abscissa starting both axes from the origin (0, 0).
(vii) Determine the slope, \( s \), of the graph.
(viii) Determine the intercept, \( c \), on the \( \log V \) axis.
(ix) Calculate the value of \( P \) in the equation \( c = \log P \).
(x) State two precautions that are necessary to ensure good results when performing the experiment in the laboratory.
[21 marks]
(b) (i) State one function each for the following circuit components:
(I) Resistor;
(II) Diode.
[2 marks]
(ii) State the four factors on which the resistance of a wire depends.
[2 marks]


Answers to Question 3a - b
(i) Read and Record \( I_i \) :
From Fig. 3(a):
\( I_1 = 1.0 \, \text{A} \)
\( I_2 = 1.5 \, \text{A} \)
\( I_3 = 2.0 \, \text{A} \)
\( I_4 = 2.5 \, \text{A} \)
\( I_5 = 3.0 \, \text{A} \)
\( I_6 = 3.5 \, \text{A} \)
(ii) Read and Record \( V_i \) :
From Fig. 3(b):
\( V_1 = 1.7 \, \text{V} \)
\( V_2 = 1.25 \, \text{V} \)
\( V_3 = 3.1 \, \text{V} \)
\( V_4 = 3.7 \, \text{V} \)
\( V_5 = 4.2 \, \text{V} \)
\( V_6 = 4.4 \, \text{V} \)
(iii) Evaluate \( P = E - V \) in Each Case:
Given: \( E = 3.0 \, \text{V} \)
\( P_1 = 3.0 - 1.7 = 1.3 \, \text{V} \)
\( P_2 = 3.0 - 1.25 = 1.75 \, \text{V} \)
\( P_3 = 3.0 - 3.1 = -0.1 \, \text{V} \)
\( P_4 = 3.0 - 3.7 = -0.7 \, \text{V} \)
\( P_5 = 3.0 - 4.2 = -1.2 \, \text{V} \)
\( P_6 = 3.0 - 4.4 = -1.4 \, \text{V} \)
(iv) Tabulated Results
| i | \( I_i \) (A) | \( V_i \) (V) | \( P_i = E - V_i \) (V) |
|---|---|---|---|
| 1 | 1.0 | 1.7 | 1.3 |
| 2 | 1.5 | 1.25 | 1.75 |
| 3 | 2.0 | 3.1 | -0.1 |
| 4 | 2.5 | 3.7 | -0.7 |
| 5 | 3.0 | 4.2 | -1.2 |
| 6 | 3.5 | 4.4 | -1.4 |
(v) Plotted Graph

(vi) Slope \( s \):
\[ s = \frac{P_2 - P_1}{I_2 - I_1} \]
Using the points \( (1.0, 1.3) \) and \( (3.5, -1.4) \):
\[ s = \frac{-1.4 - 1.3}{3.5 - 1.0}\] \[= \frac{-2.7}{2.5} = -1.08 \]
\[ \text{Slope } (s) \approx -1.08 \, \text{V/A} \]
(vii) Determine the value of \( V \) when \( I = 0 \):
From the equations:
\[ P = E - V \]
\[ P = I r \]
Substituting \( P = I r \) into the first equation:
\[ I r = E - V \Rightarrow V = E - I r \]
When \( I = 0 \):
\[ V = E - 0 = E \]
Given:
\[ E = 3.0 \, \text{V} \]
So:
\[ V = 3.0 \, \text{V} \quad \text{when} \quad I = 0 \]
(viii) Two Precautions Necessary to Ensure Accurate Results:
Ensure tight and clean connections: Loose or corroded connections can introduce additional resistance, affecting both current and voltage readings.
Avoid parallax error when reading meters: Always read the voltmeter and ammeter scales directly from above to get accurate values and prevent misreading due to viewing angle.
(b) (i) Difference between emf of a cell and p.d.
| Electromotive Force (emf) | Potential Difference (p.d.) |
|---|---|
| It is the total energy supplied by the cell per unit charge. | It is the energy used per unit charge to move between two points in a circuit. |
| It is measured when no current flows (open circuit). | It is measured when current is flowing (closed circuit). |
| emf is always greater than or equal to the terminal p.d. | p.d. is always less than or equal to the emf. |
| Symbol: \( E \) | Symbol: \( V \) |
| Unit: Volt (V) | Unit: Volt (V) |
(ii) Internal Resistance of the Cell:
Given:
\[ E = 2.0 \, \text{V},\] \[\quad R = 2.0 \, \Omega,\] \[\quad I = 0.5 \, \text{A} \]
Using the formula:
\[ E = I (R + r) \]
Solving for \( r \) (internal resistance):
\[ 2.0 = 0.5 (2 + r)\] \[\Rightarrow 2.0 = 1.0 + 0.5 r \]
\[ 1.0 = 0.5 r\] \[\Rightarrow r = \frac{1.0}{0.5} = 2.0 \, \Omega \]
Internal resistance, \( r = 2.0 \, \Omega \)