Answer two questions only
1. (a)
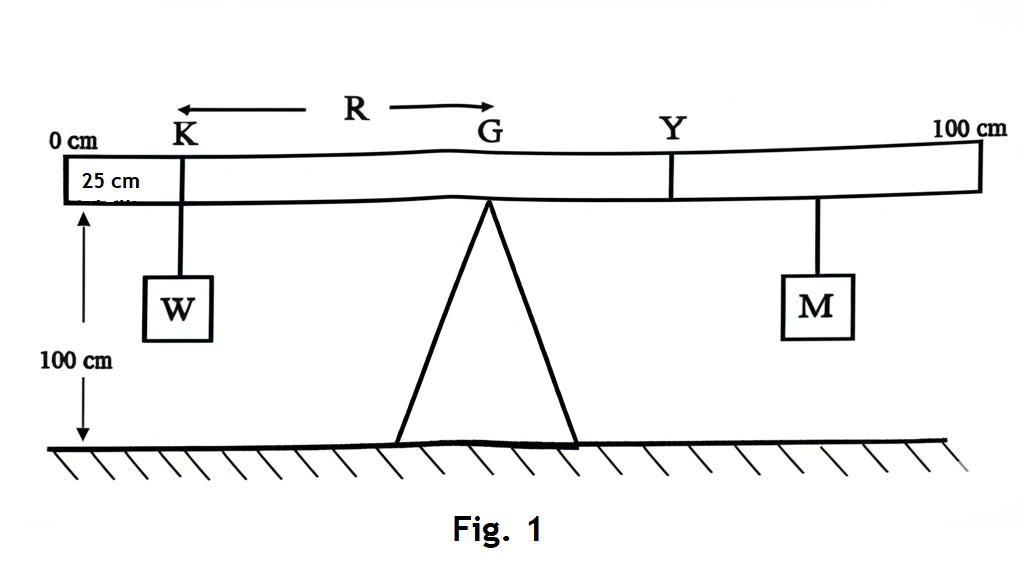
A metre rule is balanced horizontally on a knife edge and its point of balance, \( G \), on the knife edge is recorded. A fixed mass is attached securely at the 25 cm mark, \( K \), of the metre rule.
The distance \( R = KG \) is determined and recorded.
A mass, \( M \), is suspended at \( Y \) to balance the rule horizontally.
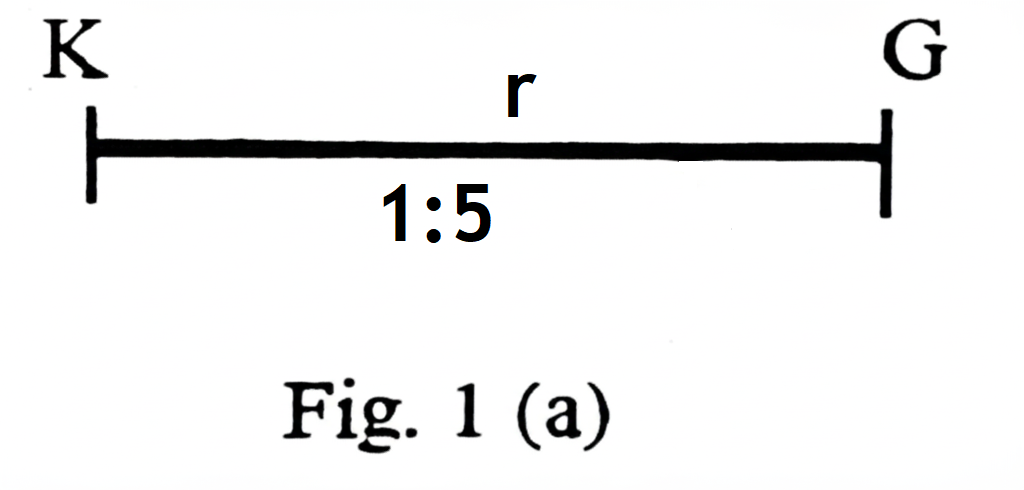
Fig. 1(a) shows the raw distance, \( r \), between \( K \) and \( G \).
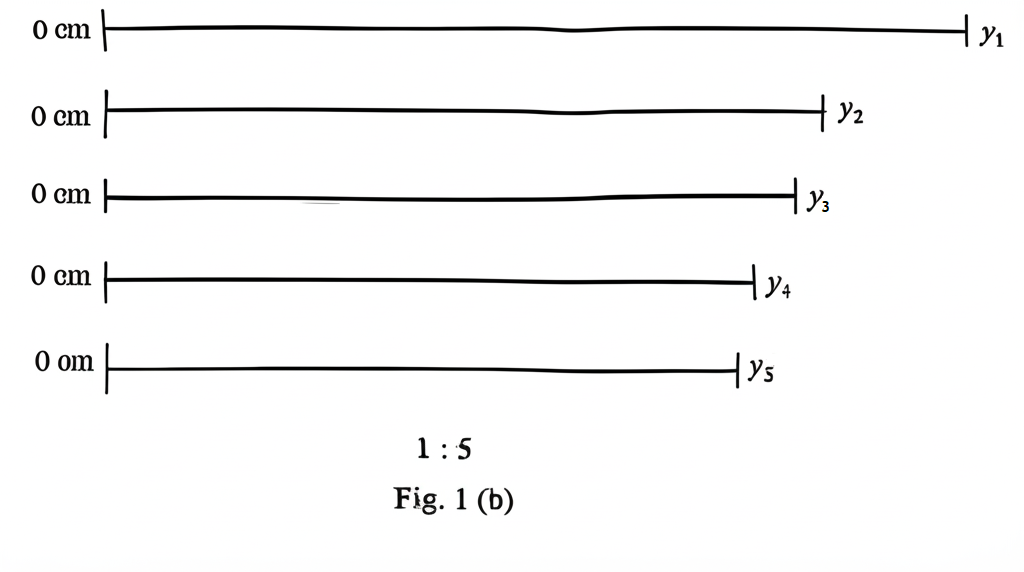
Fig. 1(b) shows the raw positions, \( y_i \), and Fig. 1(c) shows the corresponding masses \( M_i \) where \( i = 1, 2, 3, 4 \text{ and } 5 \).
(i) Measure the raw distance, \( r \), and use the scale provided to determine the actual distance \( R = KG \).
(ii) Measure the raw positions, \( y_i \), of the masses and use the scale provided to determine the actual positions, \( Y_i \), of the masses.
(iii) Record the masses, \( M_i \).
(iv) Evaluate \( M^{-1}_i \).
(v) Tabulate the results.
(vi) Plot a graph with \( Y \) on the vertical axis and \( M^{-1} \) on the horizontal axis starting both axes from the origin \( (0,0) \).
(vii) Determine the slope, \( s \), of the graph and the intercept, \( c \), on the y-axis.
(viii) Determine the value of \( W \) in the equation \( S = WR \).
(ix) State two precautions necessary to ensure good results when performing this experiment in the laboratory.
[21 marks]
(b) (i) Define a couple.
(ii) A nut on the wheel of a car requires a torque of magnitude 50 Nm to loosen it. Calculate the force that a mechanic has to exert at the end of a 25 cm wrench to loosen it.
[4 marks]
Answers to Question 1a - b
(i) Raw distance \( r \), and actual distance \( R = KG \):
From Fig. 1, the actual distance \( KG = 25 \) cm (from 25 cm to 50 cm on the metre rule).
From Fig. 1(a), the scale is \( 1:5 \), meaning 1 cm on the diagram represents 5 cm in reality.
Actual distance: \( R = 25 \) cm.
Raw distance: \( r = \frac{25}{5} = 5 \) cm.
(ii) Raw positions \( y_i \), and actual positions \( Y_i \):
From Fig. 1(b), the diagram shows five positions \( y_1 \) to \( y_5 \), with a scale of \( 1:5 \) (1 cm on the diagram represents 5 cm in reality).
Using the scale \( 1:5 \) raw positions \( y_i \) are:
\( y_1 = 1 \) cm
\( y_2 = 2 \) cm
\( y_3 = 3 \) cm
\( y_4 = 4 \) cm
\( y_5 = 5 \) cm
Using the scale \( 1:5 \) actual positions \( Y_i \) are:
\( Y_1 = y_1 \times 5 = 5 \) cm
\( Y_2 = y_2 \times 5 = 10 \) cm
\( Y_3 = y_3 \times 5 = 15 \) cm
\( Y_4 = y_4 \times 5 = 20 \) cm
\( Y_5 = y_5 \times 5 = 25 \) cm
(iii) Record the masses \( M_i \):
From Fig. 1(c), the masses \( M_1 \) to \( M_5 \) are located at angles 20°, 40°, 48°, 80°, and 100°, respectively. The diagram labels these as "Mass in grammes."
Masses correspond to the positions \( Y_i \) from Fig. 1(b), the values are:
\( M_1 = 20 \) g (at 20°)
\( M_2 = 40 \) g (at 40°)
\( M_3 = 48 \) g (at 48°)
\( M_4 = 80 \) g (at 80°)
\( M_5 = 100 \) g (at 100°)
Masses:
\( M_1 = 20 \) g
\( M_2 = 40 \) g
\( M_3 = 48 \) g
\( M_4 = 80 \) g
\( M_5 = 100 \) g
(iv) Evaluate \( M_i^{-1} \):
Calculate the inverse of each mass:
\( M_1^{-1} = \frac{1}{20} = 0.050 \) g\(^{-1}\)
\( M_2^{-1} = \frac{1}{40} = 0.025 \) g\(^{-1}\)
\( M_3^{-1} = \frac{1}{48} = 0.0208 \) g\(^{-1}\)
\( M_4^{-1} = \frac{1}{80} = 0.0125 \) g\(^{-1}\)
\( M_5^{-1} = \frac{1}{100} = 0.010 \) g\(^{-1}\)
Result:
\( M_1^{-1} = 0.050 \) g\(^{-1}\)
\( M_2^{-1} = 0.025 \) g\(^{-1}\)
\( M_3^{-1} = 0.0208 \) g\(^{-1}\)
\( M_4^{-1} = 0.0125 \) g\(^{-1}\)
\( M_5^{-1} = 0.010 \) g\(^{-1}\)
(v) Tabulated Results
| \( y_i \) (cm) | \( Y_i \) (cm) | \( M_i \) (g) | \( M_i^{-1} \) (g\(^{-1}\)) |
|---|---|---|---|
| \( 1 \) | \( 5 \) | \( 20 \) | \( 0.050 \) |
| \( 2 \) | \( 10 \) | \( 40 \) | \( 0.025 \) |
| \( 3 \) | \( 15 \) | \( 48 \) | \( 0.0208 \) |
| \( 4 \) | \( 20 \) | \( 80 \) | \( 0.0125 \) |
| \( 5 \) | \( 25 \) | \( 100 \) | \( 0.010 \) |
(vi) Plotted Graph
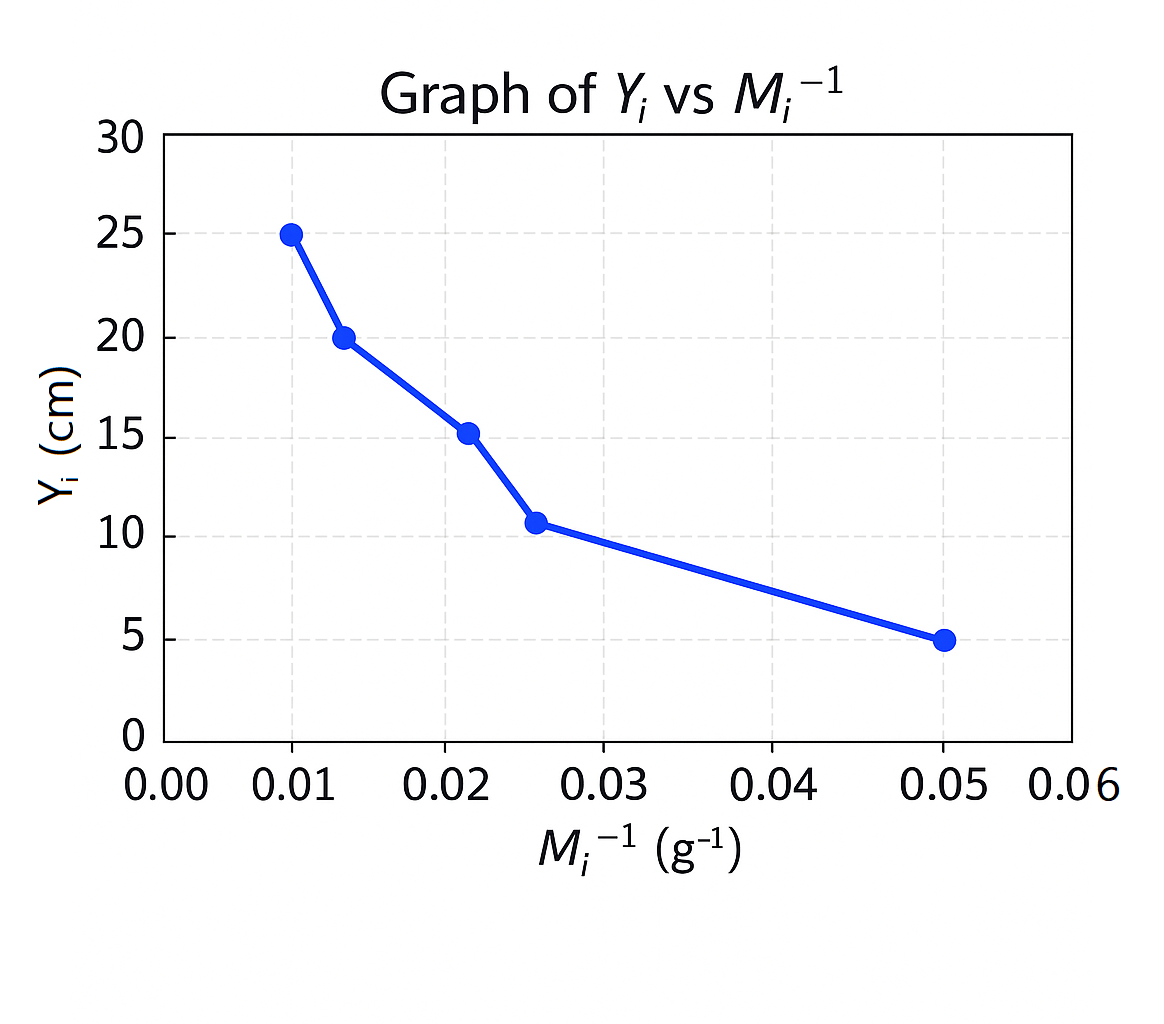
(vii) The slope \( s \) of the graph and the intercept \( c \) on the y-axis.
Using two points: \( (0.050, 5) \) and \( (0.010, 25) \)
Calculating the slope:
\[
s = \frac{25 - 5}{0.010 - 0.050}\] \[= \frac{20}{-0.040}\] \[= -500 \text{ cm} \cdot \text{g}
\]
Finding the y-intercept:
Using the equation:
\[
Y = s \cdot M^{-1} + c
\]
Substituting \( (0.050, 5) \):
\[
5 = (-500) \cdot 0.050 + c
\]
\[
5 = -25 + c
\]
\[
c = 30 \text{ cm}
\]
Result:
Slope: \( s = -500 \) cm\(\cdot\)g
Y-intercept: \( c = 30 \) cm
(viii) The value of \( W \) in the equation \( S = WR \):
Using \( S = -500 \, \text{cm} \cdot \text{g} \) and \( R = 25 \, \text{cm} \):
\[
S = W \cdot R \implies\] \[-500 = W \cdot 25
\]
\[
W = \frac{-500}{25} = -20 \, \text{g}
\]
Taking the magnitude:
\[
W = 20 \, \text{g}
\]
Result: \( W = 20 \, \text{g} \).
(ix) State two precautions necessary to ensure good results in the laboratory:
1. Ensure the knife edge is sharp and properly aligned: This minimizes friction and ensures accurate balancing.
2. Measure distances and masses accurately: Use a calibrated ruler and balance to reduce errors.
(b)(i) Couple:
A couple is a pair of equal and opposite forces acting on a body at different points, producing a net torque without causing linear acceleration.
(ii) Force needed to loosen a nut with a torque of 50 Nm using a 25 cm wrench:
Torque equation:
\[
\tau = F \cdot d
\]
Given:
\[
\tau = 50 \, \text{Nm}, \quad\] \[d = 25 \, \text{cm} = 0.25 \, \text{m}
\]
Solving for \( F \):
\[
F = \frac{\tau}{d} = \frac{50}{0.25} = 200 \, \text{N}
\]
Result: \( F = 200 \, \text{N} \).
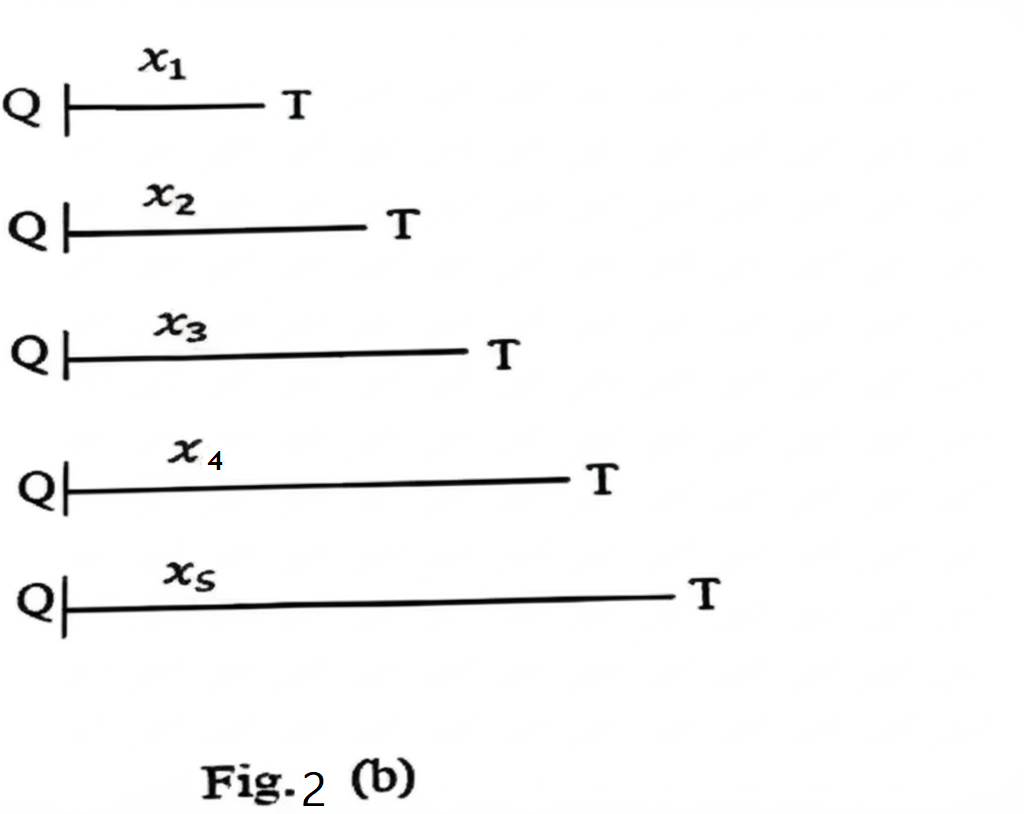
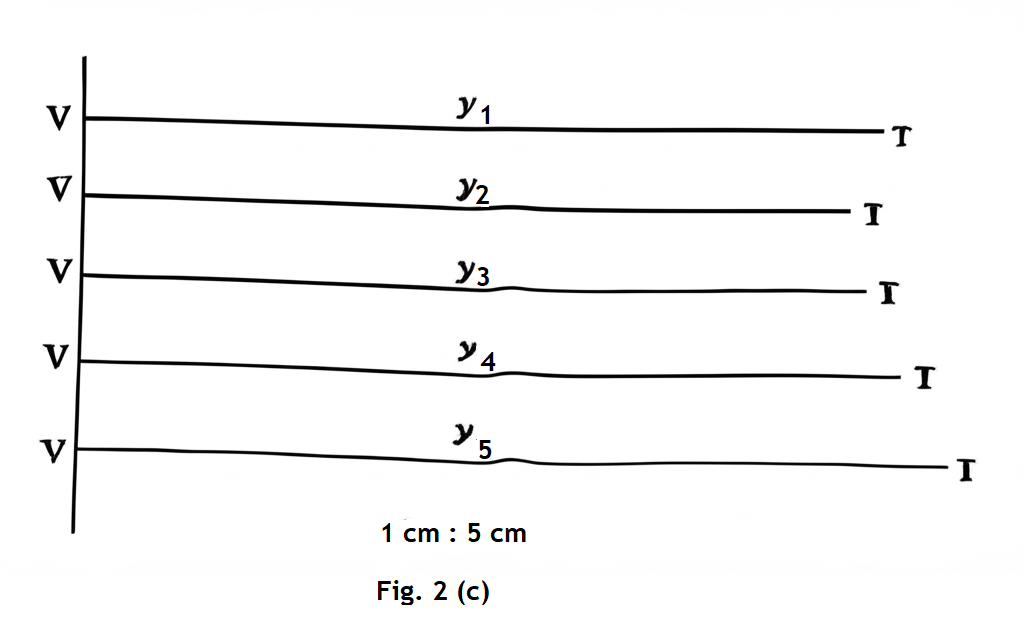
2. (a)
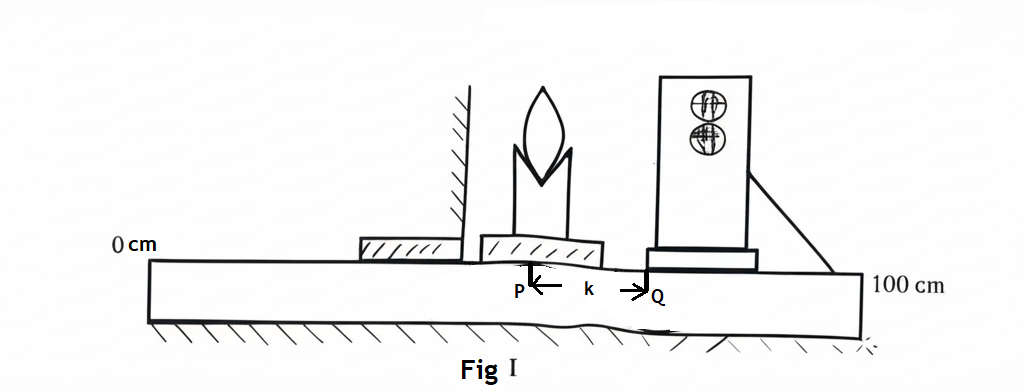
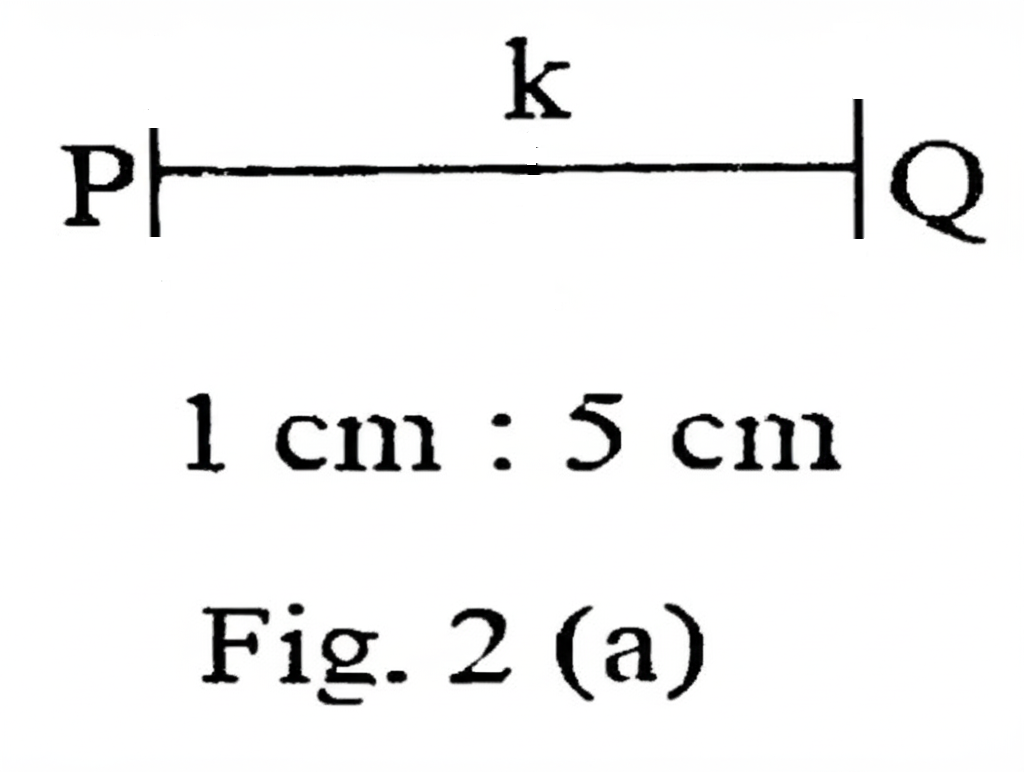
A lens is placed at a point, \( P \), on an optical bench and a plane mirror is placed behind it. A ray box is placed at \( Q \), where an illuminated object and its image coincide, as shown in Fig. 2(a). The distance \( k = PQ \) is measured and recorded.
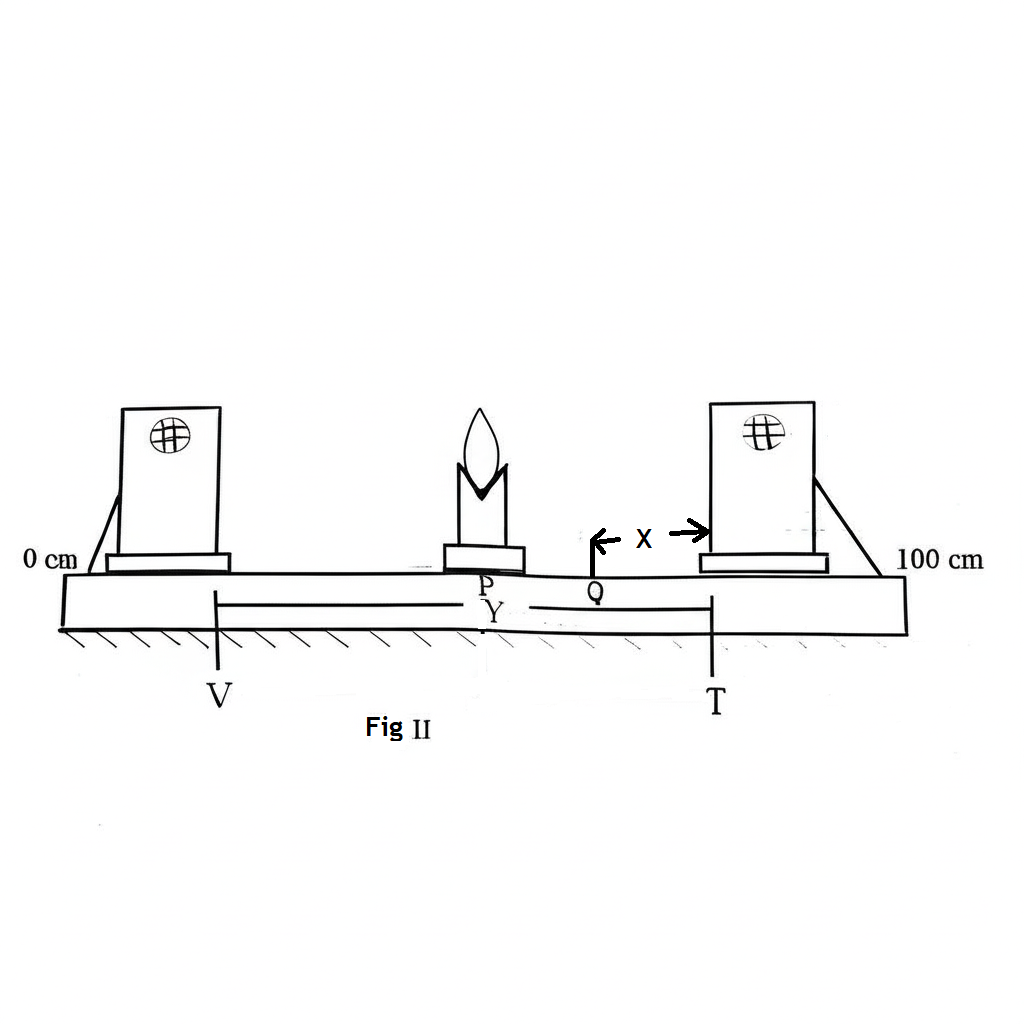
The mirror is removed, and the ray box is placed at \( T \) such that \( X = QT \), as shown in Fig. II.
A screen is put at \( V \) to receive a sharp image of the object. The distance \( Y = VT \) is measured and recorded.
Fig. 2(a) shows the raw value, \( k \).
Fig. 2(b) shows the values \( x_i \).
Fig. 2(c) shows the values \( y_i \), where \( i = 1, 2, 3, 4, \text{ and } 5 \).
(i) Measure and record the raw value \( k \), and use the scale provided to determine the actual value of \( k \).
(ii) Measure and record the raw values \( x_i \), and use the scale provided to determine the actual values of \( X \).
(iii) Measure and record the values \( y_i \), and use the scale provided to determine the actual values of \( Y \).
(iv) Evaluate \( A = k + X \), \( B = Y - A \), and \( R = \frac{A}{B} \).
(v) Tabulate the results.
(vi) Plot a graph with \( R \) on the vertical axis and \( A \) on the horizontal axis.
(vii) Determine the slope, \( s \), of the graph.
(viii) State two precautions necessary to ensure good results when performing this experiment.
[21 marks]
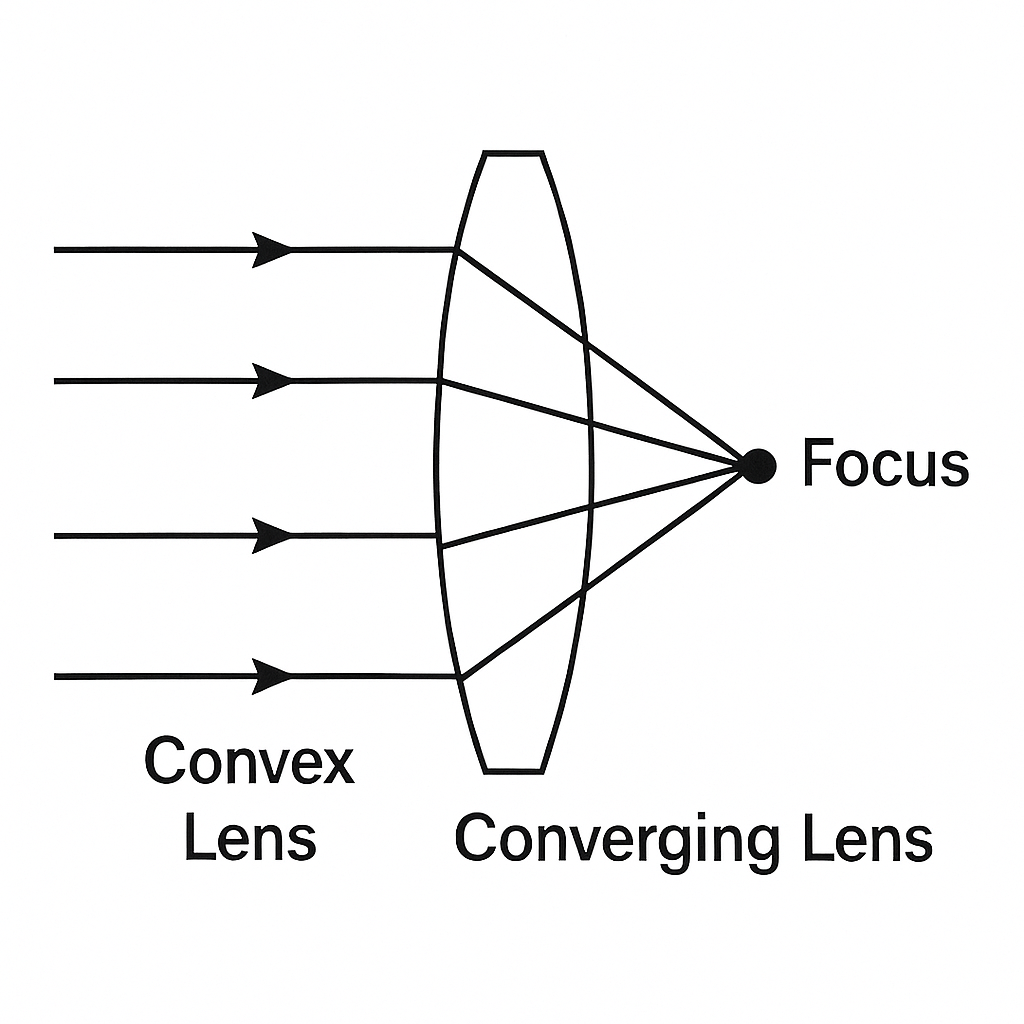
(b) (i) Draw a diagram to show why a convex lens is called a converging lens.
(ii) State two differences between a real and a virtual image.
[4 marks]
Answers to Question 2a - b
(i) Raw value \( k \) and actual value \( k \)
From Fig. I, the raw value of \( k \) (distance from P to Q) was measured as:
Raw value: \( k = 17 \) cm
Using the scale from Fig. 2(a), where:
Scale: \( 1 \) cm on paper = \( 5 \) cm actual
We compute the actual value:
Actual \( k \) = \( 17 \times 5 = 85 \) cm
(ii) Raw values \( x_1 \) to \( x_5 \) and actual values \( X_1 \) to \( X_5 \)
Given:
Raw value: \( 13 \,\text{cm} \) (same for all positions)
Scale positions: 1 to 5
Scale: \( 1\,\text{cm on paper} = 5\,\text{cm actual} \)
\[
\begin{align*}
X_1 &= 13 \times 1 = 13\,\text{cm} \\
X_2 &= 13 \times 2 = 26\,\text{cm} \\
X_3 &= 13 \times 3 = 39\,\text{cm} \\
X_4 &= 13 \times 4 = 52\,\text{cm} \\
X_5 &= 13 \times 5 = 65\,\text{cm}
\end{align*}
\]
(iii) Raw values \( y_1 \) to \( y_5 \) and actual values \( Y_1 \) to \( Y_5 \)
Given:
Raw value: \( 60 \,\text{cm} \) (same for all positions)
Scale positions: 1 to 5
Scale: \( 1\,\text{cm on paper} = 5\,\text{cm actual} \)
\[
\begin{align*}
Y_1 &= 60 \times 1 = 60\,\text{cm} \\
Y_2 &= 60 \times 2 = 120\,\text{cm} \\
Y_3 &= 60 \times 3 = 180\,\text{cm} \\
Y_4 &= 60 \times 4 = 240\,\text{cm} \\
Y_5 &= 60 \times 5 = 300\,\text{cm}
\end{align*}
\]
(iv) Evaluate \( A = k + X \), \( B = Y - A \), and \( R = \frac{A}{B} \)
Given:
\( k = 17 \) cm
\( X_1 \) to \( X_5 \): \( 13, 26, 39, 52, 65 \) cm
\( Y_1 \) to \( Y_5 \): \( 60, 120, 180, 240, 300 \) cm
For each set:
\( A = k + X \), \( B = Y - A \), \( R = \frac{A}{B} \)
Position 1:
\( A_1 = 17 + 13 = 30 \) cm
\( B_1 = 60 - 30 = 30 \) cm
\( R_1 = \frac{30}{30} = 1.00 \)
Position 2:
\( A_2 = 17 + 26 = 43 \) cm
\( B_2 = 120 - 43 = 77 \) cm
\( R_2 = \frac{43}{77} \approx 0.558 \)
Position 3:
\( A_3 = 17 + 39 = 56 \) cm
\( B_3 = 180 - 56 = 124 \) cm
\( R_3 = \frac{56}{124} \approx 0.452 \)
Position 4:
\( A_4 = 17 + 52 = 69 \) cm
\( B_4 = 240 - 69 = 171 \) cm
\( R_4 = \frac{69}{171} \approx 0.404 \)
Position 5:
\( A_5 = 17 + 65 = 82 \) cm
\( B_5 = 300 - 82 = 218 \) cm
\( R_5 = \frac{82}{218} \approx 0.376 \)
(v) Tabulated Results
| \( X \) (cm) | \( Y \) (cm) | \( A = k + X \) (cm) | \( B = Y - A \) (cm) | \( R = \dfrac{A}{B} \) |
|---|---|---|---|---|
| \( 13 \) | \( 60 \) | \( 30 \) | \( 30 \) | \( 1.000 \) |
| \( 26 \) | \( 120 \) | \( 43 \) | \( 77 \) | \( 0.558 \) |
| \( 39 \) | \( 180 \) | \( 56 \) | \( 124 \) | \( 0.452 \) |
| \( 52 \) | \( 240 \) | \( 69 \) | \( 171 \) | \( 0.404 \) |
| \( 65 \) | \( 300 \) | \( 82 \) | \( 218 \) | \( 0.376 \) |
(vi) Plotted Graph
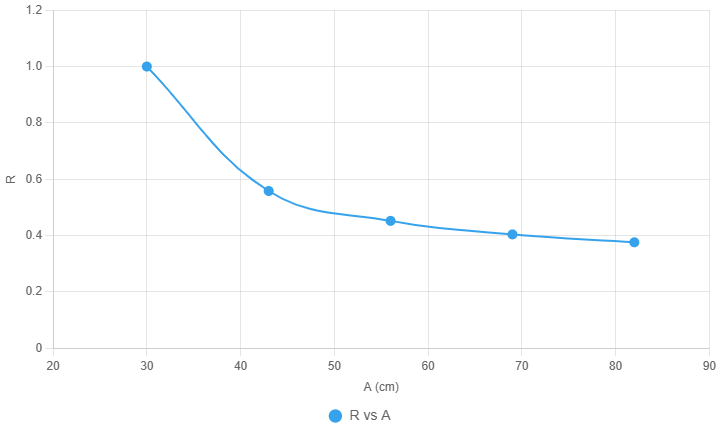
(vii) Determine the slope \( s \) of the graph.
To find the slope of the curve \( R \) vs. \( A \), we assume a straight-line approximation between two well-separated points:
Point 1: \( (A_1, R_1) = (30, 1.000) \)
Point 5: \( (A_5, R_5) = (82, 0.376) \)
Using the slope formula:
\[
s = \frac{R_5 - R_1}{A_5 - A_1}
\]
Substituting the values:
\[
s = \frac{0.376 - 1.000}{82 - 30}\] \[= \frac{-0.624}{52} \approx -0.012
\]
Ensure the lens and mirror are properly aligned:
The optical components (lens, mirror, ray box) must be precisely aligned along the same optical axis to avoid parallax errors and to ensure accurate measurements of object and image positions.
Avoid parallax when taking readings:
Your eye should be directly in line with the scale when reading measurements to prevent errors caused by viewing from an angle.
b(i) diagram showing why convex lens is called a converging lens
(ii) Two differences between a real and a virtual image:
Formation: A real image forms where light rays actually meet, like on a screen.
A virtual image forms where light rays only seem to come from, like in a mirror.
Projection: A real image can be shown on a surface, like a projector screen.
A virtual image can’t be projected because the rays don’t really meet.
3. (a)

The circuit above is used to determine the electric power of a device. The circuit is closed and the rheostat is adjusted. The current, \( I \), registered on the ammeter is recorded.
The corresponding voltage registered on the voltmeter is recorded.
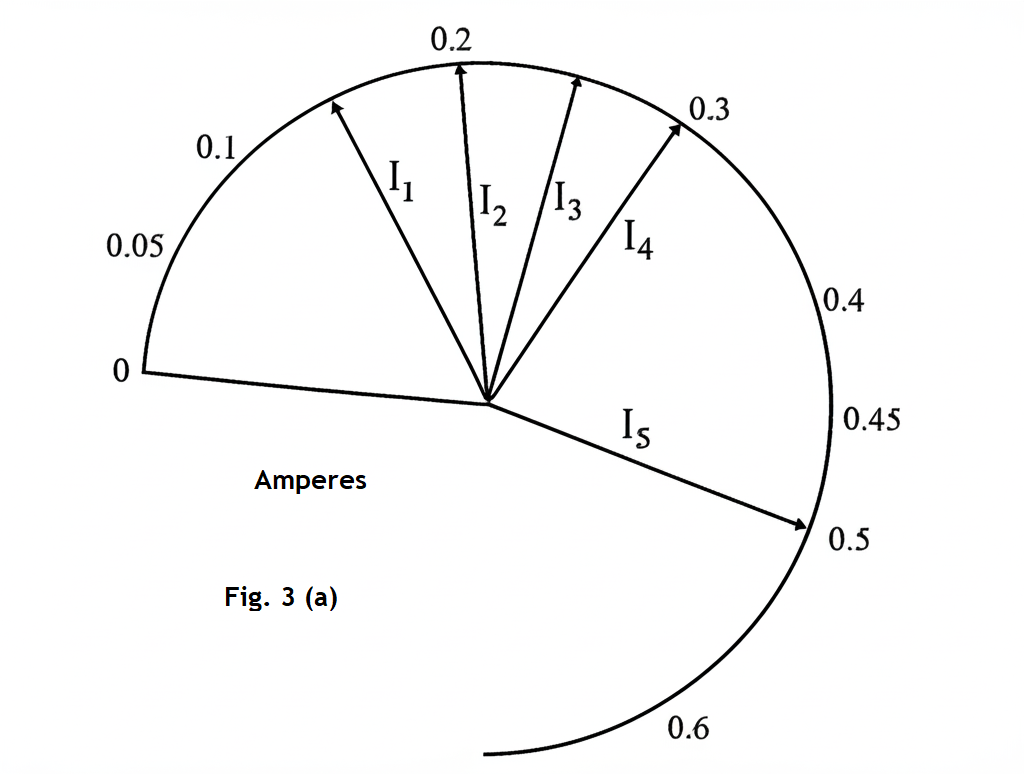
Fig. 3(a) shows the values of the current, \( I_i \),
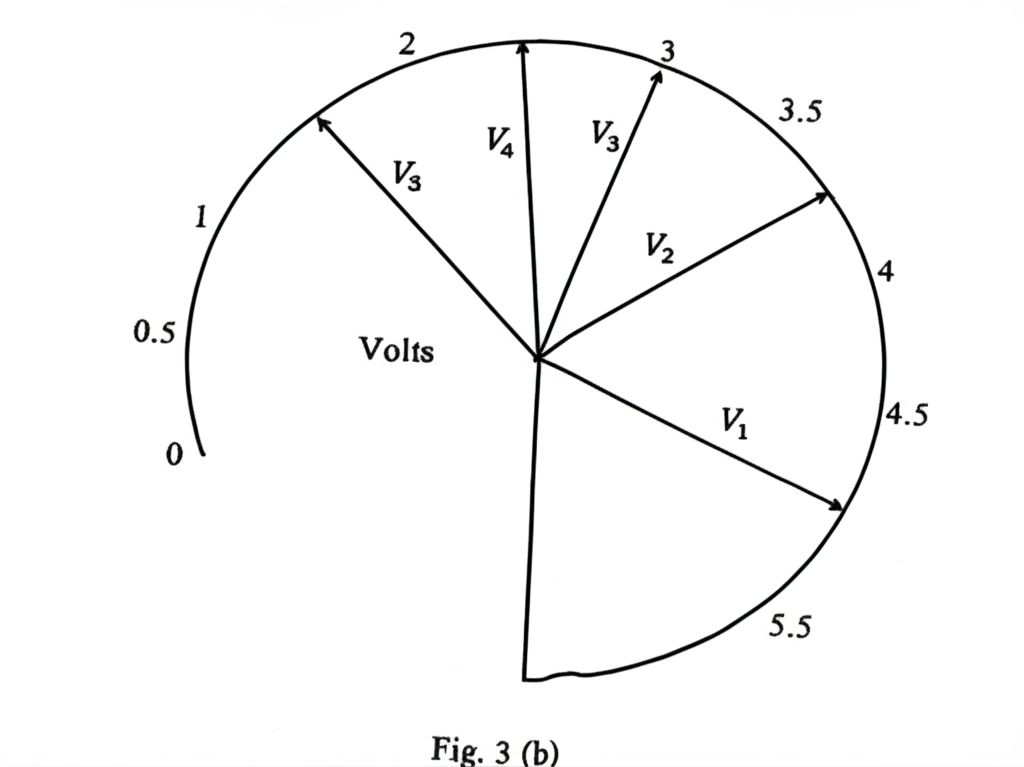
Fig. 3(b) shows the corresponding values of voltage, \( V_i \),
where \( i = 1, 2, 3, 4 \text{ and } 5 \).
(i) Record the values, \( I_i \).
(ii) Evaluate \( \log I_i \).
(iii) Record the values, \( V_i \).
(iv) Evaluate \( \log V_i \).
(v) Tabulate the results.
(vi) Plot a graph with \( \log V \) as ordinate and \( \log I \) as abscissa starting both axes from the origin (0, 0).
(vii) Determine the slope, \( s \), of the graph.
(viii) Determine the intercept, \( c \), on the \( \log V \) axis.
(ix) Calculate the value of \( P \) in the equation \( c = \log P \).
(x) State two precautions that are necessary to ensure good results when performing the experiment in the laboratory.
[21 marks]
(b) (i) State one function each for the following circuit components:
(I) Resistor;
(II) Diode.
(ii) State the four factors on which the resistance of a wire depends.
[4 marks]
Answers to Question 3a - b
(i) Record the values, \( I_i \):
From Fig. 3(a):
\( I_1 = 0.15 \, A \)
\( I_2 = 0.20 \, A \)
\( I_3 = 0.25 \, A \)
\( I_4 = 0.30 \, A \)
\( I_5 = 0.50 \, A \)
(ii) Evaluate \( \log I_i \):
\( \log I_1 = \log_{10}(0.15) = -0.824 \)
\( \log I_2 = \log_{10}(0.20) = -0.699 \)
\( \log I_3 = \log_{10}(0.25) = -0.602 \)
\( \log I_4 = \log_{10}(0.30) = -0.523 \)
\( \log I_5 = \log_{10}(0.50) = -0.301 \)
(iii) Record the values, \( V_i \):
From Fig. 3(b):
\( V_1 = 5.0 \, V \)
\( V_2 = 3.75 \, V \)
\( V_3 = 3.0 \, V \)
\( V_4 = 2.5 \, V \)
\( V_5 = 1.6 \, V \)
(iv) Evaluate \( \log V_i \):
\( \log V_1 = \log_{10}(5.0) = 0.699 \)
\( \log V_2 = \log_{10}(3.75) = 0.574 \)
\( \log V_3 = \log_{10}(3.0) = 0.477 \)
\( \log V_4 = \log_{10}(2.5) = 0.398 \)
\( \log V_5 = \log_{10}(1.6) = 0.204 \)
(v) Tabulated Results
| \( I_i \) (A) | \( \log I_i \) | \( V_i \) (V) | \( \log V_i \) |
|---|---|---|---|
| 0.15 | –0.824 | 5.0 | 0.699 |
| 0.20 | –0.699 | 3.75 | 0.574 |
| 0.25 | –0.602 | 3.0 | 0.477 |
| 0.30 | –0.523 | 2.5 | 0.398 |
| 0.50 | –0.301 | 1.6 | 0.204 |
(vi) Plotted Graph
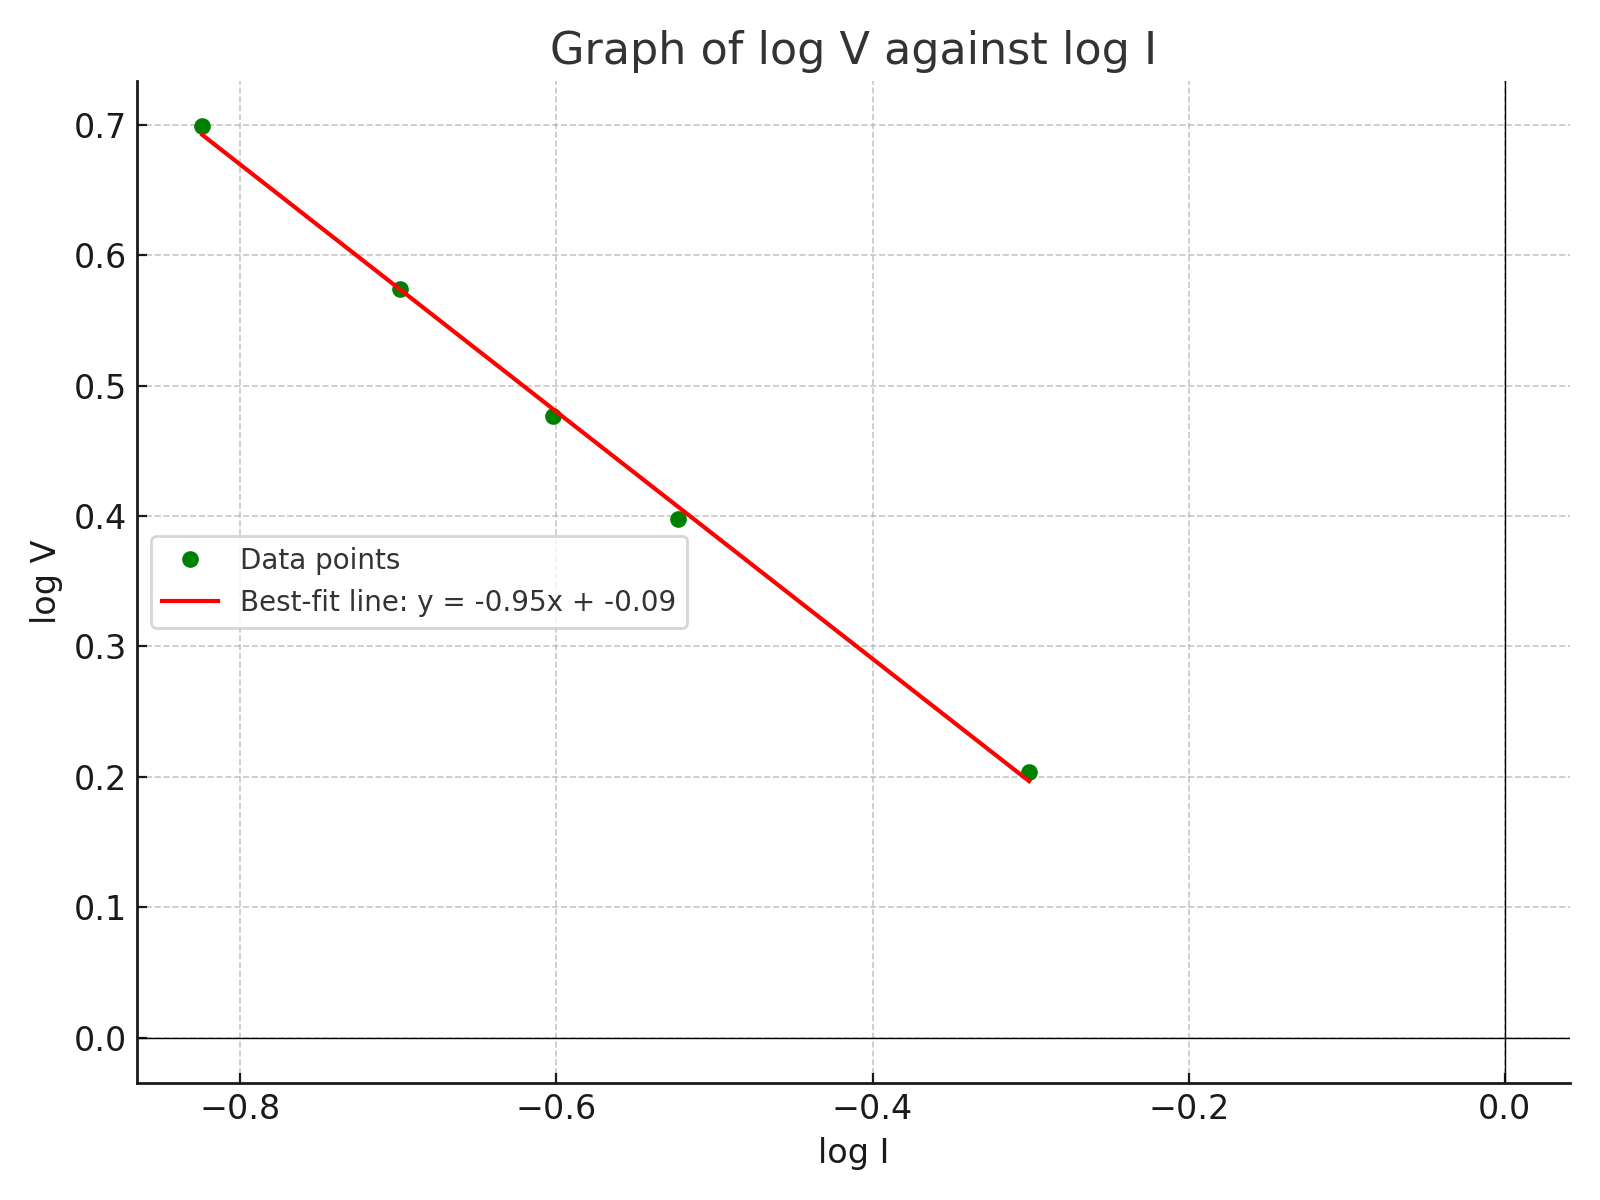
(vii) Slope \( s \):
\[ s = \frac{\log V_2 - \log V_1}{\log I_2 - \log I_1} \]
Using the points \( (-0.824, 0.699) \) and \( (-0.301, 0.204) \):
\[ s = \frac{0.204 - 0.699}{-0.301 - (-0.824)}\] \[= \frac{-0.495}{0.523} \approx -0.946 \]
\[ \text{Slope } (s) \approx -0.946 \, \text{V/A} \]
(viii) Intercept of \( c \), on the log \( V \) axis:
Using the equation of a straight line:
\[ \log V = s \cdot \log I + c \]
Substitute \( s = -0.946 \) and the point \( (\log I_1, \log V_1)\)
\(= (-0.824, 0.699) \):
\[ 0.699 = (-0.946)(-0.824) + c\] \[ \Rightarrow 0.699 = 0.779 + c\] \[ \Rightarrow c = 0.699 - 0.779 = -0.080 \]
\[ \text{Intercept } (c) \approx -0.080 \]
(ix) Value of \( P \) in the equation \( c = \log P \):
From (viii), \( c = -0.080 \). So:
\[ \log P = -0.080 \Rightarrow P = 10^{-0.080}\] \[ \Rightarrow P \approx 0.832 \, \text{W} \]
\[ \text{Therefore, } P \approx 0.832 \, \text{W} \]
(x) Two precautions to ensure good results:
(b) (i) Function of each of the following components:
Resistor: Limits or controls the current flowing through a circuit.
Diode: Allows current to flow in only one direction and blocks it in the reverse direction.
(ii) Factors on which the resistance of a wire depends: